Port Diagram
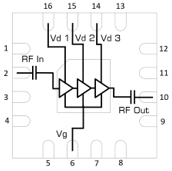
A port diagram of the AMM-7210SM’s QFN package is shown below. The pin functions are detailed below.

END OF LIFE

Sales: 408-778-9952 | General: 408-778-4200 | Fax: 408-778-4300
Sales & Customer Support: [email protected]
Tech Support: [email protected]
The AMM-7210SM is a surface-mount amplifier suitable for use as a single tone driver or general-purpose gain block. It can drive an L or H diode mixer from 25 to 50 GHz, or S diode mixer from 27 to 50 GHz. This amplifier also has exceptionally low input and output reflections, and a positive gain slope. The AMM-7210SM is packaged in a compact 3mm QFN for surface mount integration onto printed circuit boards.

| Part Number | Description | Package | Green Status | Product Lifecycle | Export Classification | Recommended Replacement |
|---|---|---|---|---|---|---|
| AMM-7210SM | 25-50 GHz GaAs Surface Mount LO Driver Amplifier | QFN | REACH RoHS | End of Life | 3A001.b.2.d | AMM-8211PSM |
| EVAL-AMM-7210SM | 25-50 GHz GaAs Surface Mount LO Driver Amplifier | EVAL | REACH RoHS | End of Life | EAR99 | EVB-AMM-8211P |
| Part Number | Description | Package | Green Status | Product Lifecycle | Export Classification | Recommended Replacement |
|---|---|---|---|---|---|---|
| AMM-7210SM | 25-50 GHz GaAs Surface Mount LO Driver Amplifier | QFN | REACH RoHS | End of Life | 3A001.b.2.d | AMM-8211PSM |
| EVAL-AMM-7210SM | 25-50 GHz GaAs Surface Mount LO Driver Amplifier | EVAL | REACH RoHS | End of Life | EAR99 | EVB-AMM-8211P |
AMM-7210SM
25-50 GHz GaAs Surface Mount LO Driver Amplifier
| Revision Code | Revision Date | Comment |
|---|---|---|
| - | 2021-06-01 | Datasheet Initial Release |
| A | 2026-03-19 | End of Life |
AMM-7210SM
25-50 GHz GaAs Surface Mount LO Driver Amplifier
A port diagram of the AMM-7210SM’s QFN package is shown below. The pin functions are detailed below.
AMM-7210SM
25-50 GHz GaAs Surface Mount LO Driver Amplifier
| Port | Function | Description | DC Equivalent Circuit |
|---|---|---|---|
| GND | Ground | Ground paddle and non-connected pins must be connected to a DC/RF ground potential with high thermal and electrical conductivity, and low inductance. |  |
| Pin 10 | RF Output | Pin 10 is the RF output of the amplifier, and is matched to 50 ohms. It is internally DC blocked. |  |
| Pin 14 | Positive DC Supply Vd 1 | Pins 14 provides +2.5V to +4V DC voltage to the amplifier’s third stage. Negative voltage must be supplied to Pin 6 before turning on the positive supply voltage. |  |
| Pin 15 | Positive DC Supply Vd 2 | Pins 15 provides +2.5V to +4V DC voltage to the amplifier’s second stage. Negative voltage must be supplied to Pin 6 before turning on the positive supply voltage. | |
| Pin 16 | Positive DC Supply Vd 3 | Pins 16 provides +2.5V to +4V DC voltage to the amplifier’s first stage. Negative voltage must be supplied to Pin 6 before turning on the positive supply voltage. | |
| Pin 2 | RF Input | Pin 2 is the RF input of the amplifier, and is matched to 50 ohms. It is internally DC blocked. | |
| Pin 6 | Negative DC Supply Vg 4 | Pin 6 provides -0.4V to -0.6V of DC voltage. This must be turned on before turning on the positive supply voltage to Pin 1. |  |
[1][2][3] Pins 14, 15, and 16 may be biased together for ease of use, or individually to adjust overall performance
[4] Pin 6 may be biased with constant DC voltage, or actively biased to produce a fixed Id for consistent performance.
AMM-7210SM
25-50 GHz GaAs Surface Mount LO Driver Amplifier
The Absolute Maximum Ratings indicate limits beyond which damage may occur to the device. If these limits are exceeded, the device may be inoperable or have a reduced lifetime. This amplifier is designed and characterized in a 50Ω system, and operation in a reflective environment can cause performance degradation. Evaluation board losses are mathematically extracted from Saturated output power, Small signal gain, Noise figure, and IIP3/OIP3 specifications.
| Parameter | Maximum Rating | Unit |
|---|---|---|
| Continuous Power Dissipation (PDISS) (at 85 ˚C case temp.) 1 | 1 | W |
| Maximum Operating Temperature | 85 | °C |
| Maximum Storage Temperature | 150 | °C |
| Max Junction Temperature for MTTF > 1E6 Hours | 175 | °C |
| Minimum Operating Temperature | -40 | °C |
| Minimum Storage Temperature | -65 | °C |
| Negative Bias Voltage (Pin 6) | -2 | V |
| Positive Drain Supply Current (with RF Input) 2 | 450 | mA |
| Positive Drain Supply Voltage (Pin 14) | 4.5 | V |
| Positive Drain Supply Voltage (Pin 15) | 4.5 | V |
| Positive Drain Supply Voltage (Pin 16) | 4.5 | V |
| RF Input Power | 20 | dBm |
| Thermal Resistance, θJC | 94 | ºC/W |
[1] Derates by 11 mW/ ˚C above 85 ˚C case temperature.
[2] Positive Drain Supply DC current is specified as Id1 + Id2 + Id3
| Parameter | Details | Rating |
|---|---|---|
| Dimensions | - | 3 x 3 mm |
| Moisture Sensitivity Level | - | MSL 1 |
The Recommended Operating Conditions indicate the limits, inside which the device should be operated, to guarantee the performance given in Electrical Specifications. Operating outside these limits may not necessarily cause damage to the device, but the performance may degrade outside the limits of the Electrical Specifications. For limits, above which damage may occur, see Absolute Maximum Ratings.
| Parameter | Min | Nominal | Max | Unit |
|---|---|---|---|---|
| Ambient Temperature | -40 | 25 | 85 | °C |
| Power Supply DC Voltage Vd1 | 2.5 | 3 | 4 | V |
| Power Supply DC Voltage Vd2 | 2.5 | 3 | 4 | V |
| Power Supply DC Voltage Vd3 | 2.5 | 3 | 4 | V |
| Power Supply DC Current (no RF Input) 1 | 115 | 180 | 300 | mA |
| Gate Bias DC Voltage | -0.6 | -0.5 | -0.4 | V |
| Input Power for Saturation | 8 | 11 | 13 | dBm |
[1] Power Supply DC current is specified as Id1 + Id2 + Id3
AMM-7210SM
25-50 GHz GaAs Surface Mount LO Driver Amplifier
The electrical specifications apply at TA=+25°C in a 50Ω system. QFNs are 100% RF tested. Evaluation board losses are mathematically extracted from Saturated output power, Small signal gain, Noise figure, and IIP3/OIP3 specifications.
| Parameter | Test Conditions | Minimum Frequency (GHz) | Maximum Frequency (GHz) | Min | Typ | Max | Unit |
|---|---|---|---|---|---|---|---|
| Current Consumption 1 | Vd1 = Vd2 = +3V, Vd3 = +3.5V, Vg = -0.4V | - | - | - | 230 | - | mA |
| Current Consumption 2 | Vd1 = Vd2 = +3V, Vd3 = +3.5V, Vg = -0.5V | - | - | - | 180 | - | mA |
| Current Consumption 3 | Vd1 = Vd2 = +3V, Vd3 = +3.5V, Vg = -0.6V | - | - | - | 130 | - | mA |
| Input IP3 | Vd1 = Vd2 = +3V, Vd3 = +3.5V, Vg = -0.5V Bias | 25 | 50 | - | 11 | - | dBm |
| Input Power for Saturation | Vd1 = Vd2 = +3V, Vd3 = +3.5V, Vg = -0.5V Bias | 25 | 50 | - | 11 | - | dBm |
| Input Return Loss | Vd1 = Vd2 = +3V, Vd3 = +3.5V, Vg = -0.5V Bias, -20 dBm Input Power | 25 | 50 | - | 14 | - | dB |
| Noise Figure | Vd1 = Vd2 = +3V, Vd3 = +3.5V, Vg = -0.5V Bias | 25 | 50 | - | 5.6 | - | dB |
| Output IP3 | Vd1 = Vd2 = +3V, Vd3 = +3.5V, Vg = -0.5V Bias | 25 | 50 | - | 26 | - | dBm |
| Output P1dB | Vd1 = Vd2 = +3V, Vd3 = +3.5V, Vg = -0.5V Bias | 25 | 50 | - | 20 | - | dBm |
| Output Return Loss | Vd1 = Vd2 = +3V, Vd3 = +3.5V, Vg = -0.5V Bias, -20 dBm Input Power | 25 | 50 | - | 16 | - | dB |
| Reverse Isolation | Vd1 = Vd2 = +3V, Vd3 = +3.5V, Vg = -0.5V Bias, -20 dBm Input Power | 25 | 50 | - | 49 | - | dB |
| Saturated Output Power 4 | Vd1 = Vd2 = +3V, Vd3 = +3.5V, Vg = -0.5V Bias | 35 | 45 | 17 | 23 | - | dBm |
| Saturated Output Power 5 | Vd1 = Vd2 = +3V, Vd3 = +3.5V, Vg = -0.5V Bias | 45 | 50 | - | 21 | - | dBm |
| Saturated Output Power 6 | Vd1 = Vd2 = +3V, Vd3 = +3.5V, Vg = -0.5V Bias | 25 | 35 | - | 20 | - | dBm |
| Small Signal Gain | Vd1 = Vd2 = +3V, Vd3 = +3.5V, Vg = -0.5V Bias, -20 dBm Input Power | 35 | 45 | 9 | 15 | - | dB |
| Small Signal Gain | Vd1 = Vd2 = +3V, Vd3 = +3.5V, Vg = -0.5V Bias, -20 dBm Input Power | 25 | 35 | - | 13 | - | dB |
| Small Signal Gain | Vd1 = Vd2 = +3V, Vd3 = +3.5V, Vg = -0.5V Bias, -20 dBm Input Power | 45 | 50 | - | 15 | - | dB |
| Parameter | Test Conditions | Minimum Frequency (GHz) | Maximum Frequency (GHz) | Min | Typ | Max | Unit |
|---|---|---|---|---|---|---|---|
| Current Consumption 1 | Vd1 = Vd2 = +3V, Vd3 = +3.5V, Vg = -0.4V | - | - | - | 230 | - | mA |
| Current Consumption 2 | Vd1 = Vd2 = +3V, Vd3 = +3.5V, Vg = -0.5V | - | - | - | 180 | - | mA |
| Current Consumption 3 | Vd1 = Vd2 = +3V, Vd3 = +3.5V, Vg = -0.6V | - | - | - | 130 | - | mA |
| Input IP3 | Vd1 = Vd2 = +3V, Vd3 = +3.5V, Vg = -0.5V Bias | 25 | 50 | - | 11 | - | dBm |
| Input Power for Saturation | Vd1 = Vd2 = +3V, Vd3 = +3.5V, Vg = -0.5V Bias | 25 | 50 | - | 11 | - | dBm |
| Input Return Loss | Vd1 = Vd2 = +3V, Vd3 = +3.5V, Vg = -0.5V Bias, -20 dBm Input Power | 25 | 50 | - | 14 | - | dB |
| Noise Figure | Vd1 = Vd2 = +3V, Vd3 = +3.5V, Vg = -0.5V Bias | 25 | 50 | - | 5.6 | - | dB |
| Output IP3 | Vd1 = Vd2 = +3V, Vd3 = +3.5V, Vg = -0.5V Bias | 25 | 50 | - | 26 | - | dBm |
| Output P1dB | Vd1 = Vd2 = +3V, Vd3 = +3.5V, Vg = -0.5V Bias | 25 | 50 | - | 20 | - | dBm |
| Output Return Loss | Vd1 = Vd2 = +3V, Vd3 = +3.5V, Vg = -0.5V Bias, -20 dBm Input Power | 25 | 50 | - | 16 | - | dB |
| Reverse Isolation | Vd1 = Vd2 = +3V, Vd3 = +3.5V, Vg = -0.5V Bias, -20 dBm Input Power | 25 | 50 | - | 49 | - | dB |
| Saturated Output Power 4 | Vd1 = Vd2 = +3V, Vd3 = +3.5V, Vg = -0.5V Bias | 35 | 45 | 17 | 23 | - | dBm |
| Saturated Output Power 5 | Vd1 = Vd2 = +3V, Vd3 = +3.5V, Vg = -0.5V Bias | 45 | 50 | - | 21 | - | dBm |
| Saturated Output Power 6 | Vd1 = Vd2 = +3V, Vd3 = +3.5V, Vg = -0.5V Bias | 25 | 35 | - | 20 | - | dBm |
| Small Signal Gain | Vd1 = Vd2 = +3V, Vd3 = +3.5V, Vg = -0.5V Bias, -20 dBm Input Power | 35 | 45 | 9 | 15 | - | dB |
| Small Signal Gain | Vd1 = Vd2 = +3V, Vd3 = +3.5V, Vg = -0.5V Bias, -20 dBm Input Power | 25 | 35 | - | 13 | - | dB |
| Small Signal Gain | Vd1 = Vd2 = +3V, Vd3 = +3.5V, Vg = -0.5V Bias, -20 dBm Input Power | 45 | 50 | - | 15 | - | dB |
[1][2][3] Bias conditions for Id tested with no RF input power. See Typical Performance Plots for DC current vs. RF power. Bias conditions presented as Vd/Vg. Drain current is specified as Id1 + Id2 + Id3
[4][5][6] Saturated output power specification defined using the EVAL-APM-7210SM P5dB compression curve shown in Typical Performance Plots.
AMM-7210SM
25-50 GHz GaAs Surface Mount LO Driver Amplifier
Measurement data taken using the EVAL-AMM-7210SM module.
Evaluation board losses are mathematically extracted out of Output Compression Curves, Small Signal Gain, Noise Figure, and IP3 plots.


AMM-7210SM
25-50 GHz GaAs Surface Mount LO Driver Amplifier


AMM-7210SM
25-50 GHz GaAs Surface Mount LO Driver Amplifier
Measurement data taken using the EVAL-AMM-7210SM module.
¹⁴Drain current is specified as Id1 + Id2 + Id3


AMM-7210SM
25-50 GHz GaAs Surface Mount LO Driver Amplifier


AMM-7210SM
25-50 GHz GaAs Surface Mount LO Driver Amplifier


AMM-7210SM
25-50 GHz GaAs Surface Mount LO Driver Amplifier
Plots taken using EVAL-AMM-7210SM as LO driver for connectorized MM1-1857H module in configuration A with a 91MHz IF. Power specified is input power to EVAL-AMM-7210SM driver.


AMM-7210SM
25-50 GHz GaAs Surface Mount LO Driver Amplifier
Plots taken using EVAL-AMM-7210SM as LO driver for the EVAL-MMIQ-1867LSM in configuration A with a 6GHz IF. Power specified is input power to EVAL-AMM-7210SM driver.


AMM-7210SM
25-50 GHz GaAs Surface Mount LO Driver Amplifier

AMM-7210SM
25-50 GHz GaAs Surface Mount LO Driver Amplifier
AMM-7210SM
25-50 GHz GaAs Surface Mount LO Driver Amplifier
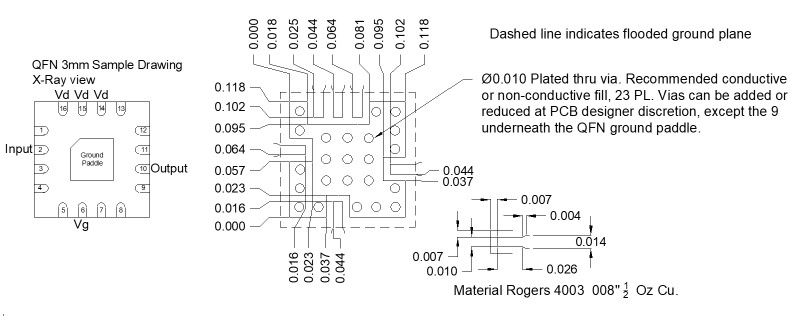
Download : Footprint Drawing
AMM-7210SM
25-50 GHz GaAs Surface Mount LO Driver Amplifier