Package Information
| Parameter | Details | Rating |
|---|---|---|
| Dimensions | - | 25.39x50.80 mm |
Sales: 408-778-9952 | General: 408-778-4200 | Fax: 408-778-4300
Sales & Customer Support: [email protected]
Tech Support: [email protected]
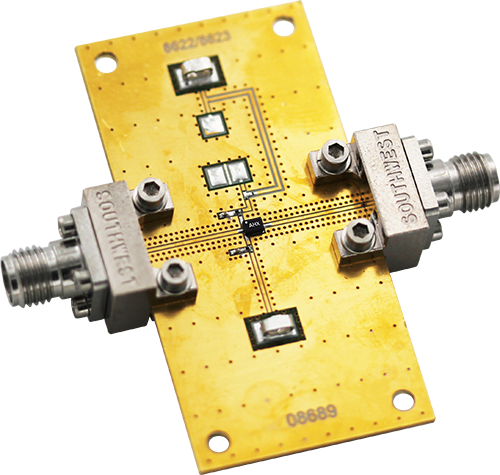
The EVB-ADM-8622P is the evaluation board for the ADM-8622PSM high-linearity low noise amplifier. This EVB is not self-contained and requires an external bias-tee or inductor to connect RF In (input RF connector) and +Vref pins (top clip on EVB). See ADM-8622PSM datasheet for details. The EVB is built using 2.92mm RF connectors. The ADM-8622PSM is capable of providing 15.5 dB gain, 2 dB noise figure and +26 dBm OIP3 up to 10 GHz.
N/A
N/A

| Part Number | Description | Package | Green Status | Product Lifecycle | Export Classification |
|---|---|---|---|---|---|
| ADM-8622PSM | DC - 10 GHz High Dynamic Range Gain Block | DFN | REACH RoHS | Released | EAR99 |
| EVB-ADM-8622P | Evaluation Board, DC - 10 GHz High Dynamic Range Gain Block Amplifier | EVB | REACH RoHS | Released | EAR99 |
EVB-ADM-8622P
Evaluation Board, DC - 10 GHz High Dynamic Range Gain Block Amplifier
EVB-ADM-8622P
Evaluation Board, DC - 10 GHz High Dynamic Range Gain Block Amplifier
| Parameter | Details | Rating |
|---|---|---|
| Dimensions | - | 25.39x50.80 mm |
EVB-ADM-8622P
Evaluation Board, DC - 10 GHz High Dynamic Range Gain Block Amplifier


EVB-ADM-8622P
Evaluation Board, DC - 10 GHz High Dynamic Range Gain Block Amplifier


EVB-ADM-8622P
Evaluation Board, DC - 10 GHz High Dynamic Range Gain Block Amplifier

EVB-ADM-8622P
Evaluation Board, DC - 10 GHz High Dynamic Range Gain Block Amplifier
EVB-ADM-8622P
Evaluation Board, DC - 10 GHz High Dynamic Range Gain Block Amplifier
EVB-ADM-8622P
Evaluation Board, DC - 10 GHz High Dynamic Range Gain Block Amplifier